Copper enters the global market in many shapes and sizes: copper concentrates, blister and anode, cathode and ingots, scrap, semis and powders, and compounds. All forms are traded globally. Copper is traded along every link in the supply chain, from the mine to the end-user product. It must first be smelted, refined and transformed into shapes or alloys before it is ready for fabrication in brass mills, foundries, wire mills or other plants. In the final stage, industries transform the copper into end-use products such as cars, domestic appliances, electronic equipment, etc.
The supply chain for copper is complex due to the high level of copper recycling, which cannot be distinguished from primary copper once it is reprocessed. This involves different trade schemes in which the copper is sold many times through many countries before it is shipped directly to the end-user country. This article attempts to map the global supply chain for copper, with a specific focus on European end-users. What is the link between Zambia’s copper mining industry and European consumers?
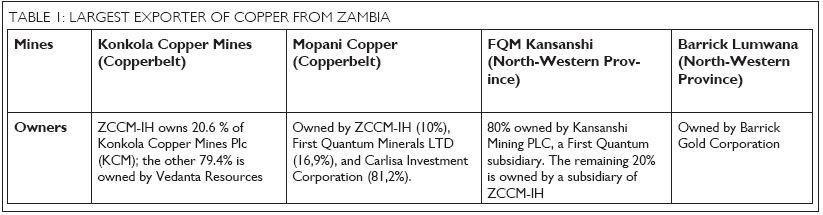
Four companies account for more than 70 percent of Zambia’s copper production, according to a survey by the International Council on Mining and Metals. These mine owners are Vedanta Resources, Barrick Gold Corporation, First Quantum Minerals (FQM) and Carlisa Investment Corporation, the latter a joint venture between Glencore and FQM.
The last two companies rank third and tenth respectively in Thomson Reuters GFMS’ Copper Survey Top Ten from June 2015. The table shows the ownership structure of the four Zambian mines. ZCCM-IH refers to Zambia Consolidated Copper Mines Investment Holdings Plc., whose majority shareholder is the government of Zambia. See table 1.
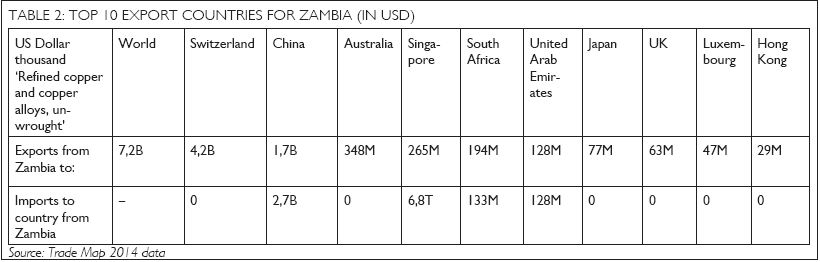
Zambia exported copper valued at approximately USD 7,2 billion in 2014. Its main importer of refined copper was Switzerland, while the main destination for its unrefined copper – 95 percent of the total – was China, according to The Atlas of Economic Complexity. Zambia’s 10 biggest export countries for ‘refined copper and copper alloys’ ‘can be seen below. See table 2.
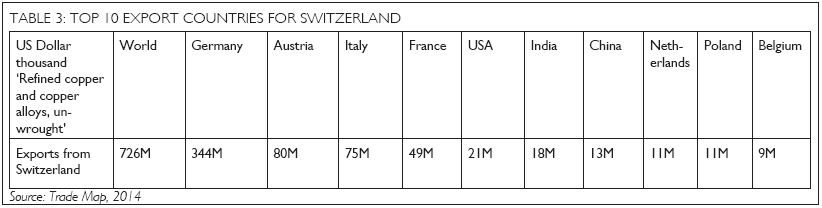
The discrepancy between exports from Zambia to Switzerland and imports to Switzerland from Zambia suggests that the copper never reaches Switzerland, but is instead bought and sold by Swiss-based traders and exported directly to manufacturers, who use copper in the production of electrical equipment or wire or construction of buildings. See table 3.
Copper are in products that are used every day. The industries reliant on copper for the production of end-user products is divided into five categories: building construction, electrical & electronic products, transportation equipment, consumer & general products, and industrial machinery & equipment. According to the World Copper Factbook, the latter is the largest copper-consuming industry, with a share of 31 percent in 2013; however, the Thomson Reuters Survey, electronics and electrical equipment is by far the largest copper-consuming industry with a global share of 39 percent. The discrepancy may be due to different ways of categorizing, but the overall picture remains. Electrical equipment and building construction are the industries with highest demands for copper.
China is the leading global consumer of copper, accounting for 44 percent of world demand in 2014. China’s demand for copper in electronics and electrical equipment is not primarily related to IT manufacturing, which requires fairly small amounts of copper, but instead to the country’s shift from coal power to electricity. This has required a rapid expansion of electrical grids. Furthermore, the expansion of the green energy sector has increased demands for wind turbines and photovoltaic panels, which are copper-intensive. Some wind farms contain over 91,000 metres of copper wire, according to The Copper Alliance.
40 to 50 percent of annual EU copper demand is sourced through recycling, which makes the supply chain even less transparent. The EU accounted for 15-19 percent of the global end-use of copper in 2014, which means copper for end use with manufacturers that makes products for consumers.
The International Copper Study Group indicates that the EU’s apparent annual refined copper usage was 3.2 million metric tons in 2014, an increase of 6 percent from the year before. 38 percent of the EU’s share of copper, or around 1,210,000 metric tons, was used in the building construction industry, making it the biggest end-user industry in EU.